

The Chuck wrote:
I wrote my paper in 2017 as a junior and I decided to write about an overview of guns, crime, and violence due to the prior happenings in Ferguson and going to class with some friends who lived in Ferguson including one who lived/lives up the block from the Quik Trip gas station that got immolated during the riots. I read over a portion of that statistical data and wrote about it. Specifically I wrote about how many of the information lines on graphs on 11-14 all follow similar trends across the board and how for burglary the non-Right to carry states have had a much higher overall issue with it. I primarily relied on the graphs themselves due to needing some visual representations for my paper. The reason I went with burglary and not simply larceny is Larceny is the act of stealing something whereas Burglary is the act of entering somewhere with intent to commit a crime, not just theft. Now if you mind Kowani, don't just do a keyword search and grab an article when You haven't read it yourself.
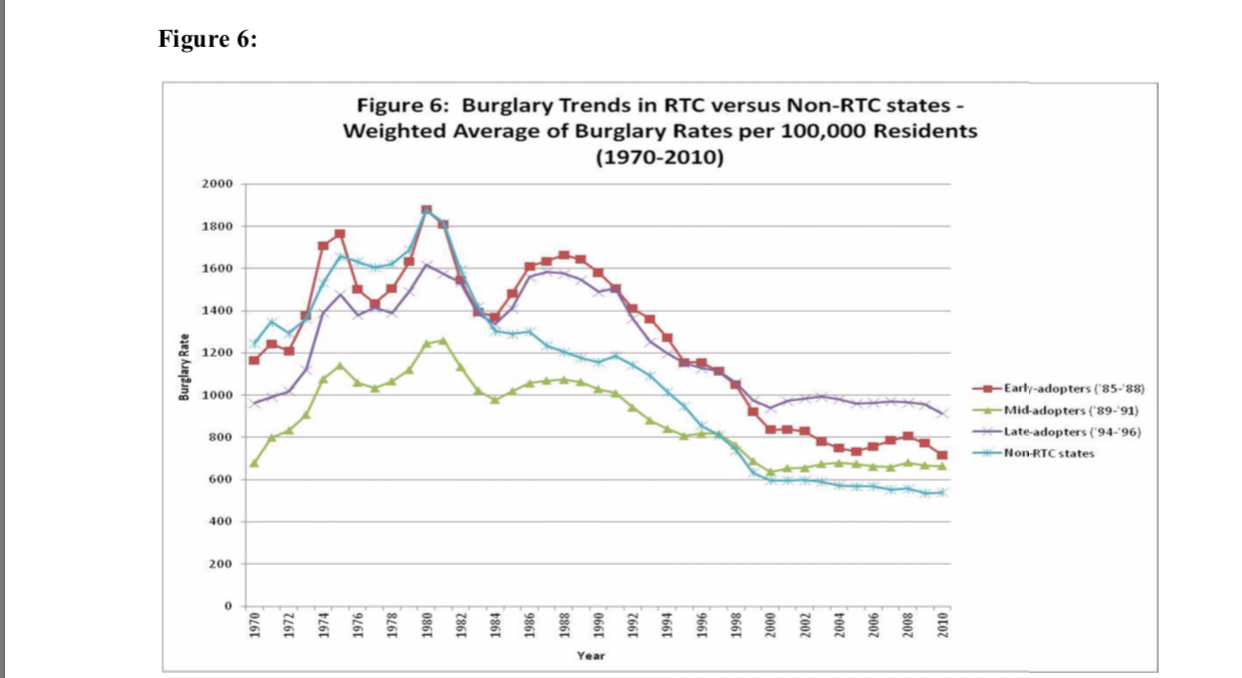
We’re not looking at the same burglary graph, are we?
Yes, the rates for non-RTC states were higher in 1982. After that, they drop off much faster than everyone else. I have actually read the paper. I’ve used it for Policy Debates at League level.


 *Goes back to mournfully scrubbing and shining the things St. Louis has to offer*