Let's start with the nitty-gritty: The site is maintained by a world-famous IT expert, Andrew Tanenbaum. Per Wikipedia:
He is best known as the author of MINIX, a free Unix-like operating system for teaching purposes, and for his computer science textbooks, regarded as standard texts in the field. He regards his teaching job as his most important work. Since 2004 he has operated a web site dedicated to analysis of polling data in U.S. federal elections.
Tennebaum's web site created something of a stir when it was launched in 2004: He refused to identify himself until the day before the election, signing his work simply as "the Votemaster". This fed intense speculation on all sides as to who this mysterious "Votemaster" was; many thought that he was an independent pollster or political consultant; both Republicans and Democrats accused him of favoring the other side in his predictions. Needless to say, when everybody found out who he was, it came as something of a shock:
Many people have asked who am I, what my qualifications are, and why am I doing this. People have speculated that I am a Clinton administration official, a bored retired statistician and more. Welcome to the Votemaster FAQ.
...
My name is Andrew Tanenbaum. I am one of the 7 million U.S. citizens living abroad. I am a professor of computer science at the Vrije Universiteit in Amsterdam, The Netherlands. Most of you have never heard of me but in an itsy-bitsy, teeny-weeny corner of the universe I have done enough stuff that Google has somehow managed to dig up 10,000 pages referring to me.
When I am not collecting data, analyzing it, or blogging, my day job is doing the kind of stuff professors at major research universities normally do. The best part is working with young people, especially my graduate students.
To answer the question of why I am in The Netherlands, my lovely wife is Dutch and long ago we decided that she couldn't do her kind of work in the U.S. whereas I could work anywhere. I visit the U.S. several times a year and am thoroughly familiar what is going on there. I also read the New York Times, the Los Angeles Times, and the Washington Post on-line every day, as well as numerous political websites and blogs.
I grew up in Westchester County, just north of New York City, a Republican bastion and then the 5th wealthiest county in the country. My parents were staunch Republicans. They liked Ike. I went to M.I.T. and then got a Ph.D. from the University of California.
Tennebaum's predictions were off in 2004, but only because the final results differed considerably from both the pre-election polling and the exit polls. Here are the final results Tanenbaum projected on November 2nd, 2004:
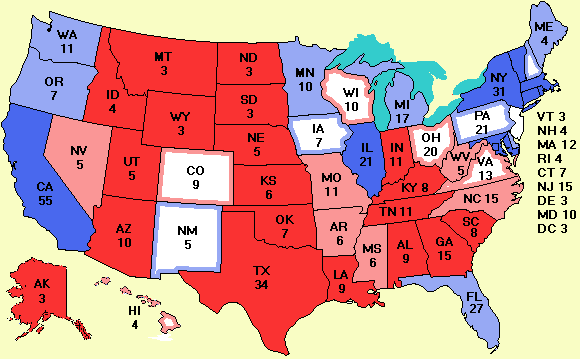
As you can see, the polling data at that time indicated that the race was a dead heat (Kerry 262, Bush 261, with New Jersey (15 EV's) too close to call). When the dust settled, here was the final map:
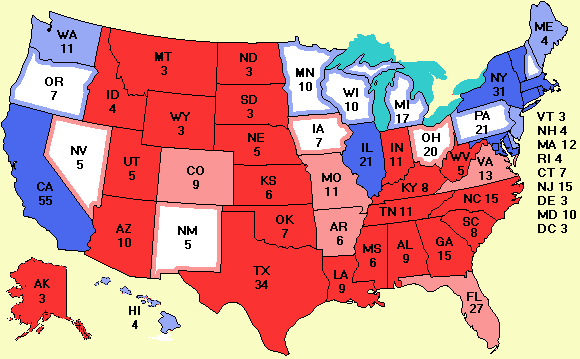
Three States flipped in the final voting from their predicted outcomes in pre-election polling: Wisconsin broke Democratic rather than Republican, while Iowa, New Mexico, and Florida broke Republican rather than Democratic, the last State by a significant margin. New Jersey, the State that was too close to call in pre-election polls, broke for the Democrats.
Of interest are also the Senate projections: Pre-election polling suggested that the Democrats would end up with 47 seats (including Bernie Sanders' seat in Vermont among their ranks, as Sanders - an independent - caucuses with the Democrats) and the GOP winning 51 (two seats were reckoned as tossups. In fact, the final balance (including Sanders with the Democrats) was 45-55, as shift of +2 for the GOP from the pre-election predictions.
Although Tanenbaum intimated that he would not maintain the site past 2008 - and that he would not use it to track another election - he relented and tracked both the 2006 and 2010 off-year elections as well as the 2008 election. In 2008, his predictions were closer; these were the final results predicted on November 4th, 2008:
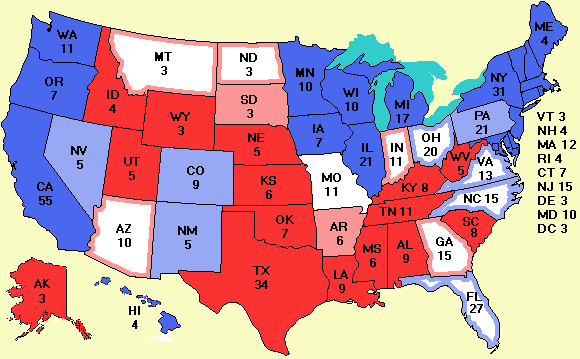
As you can see, Obama is shown leading McCain 353-174, with Missouri (11 EV's) too close to call. Compare this with the final results:
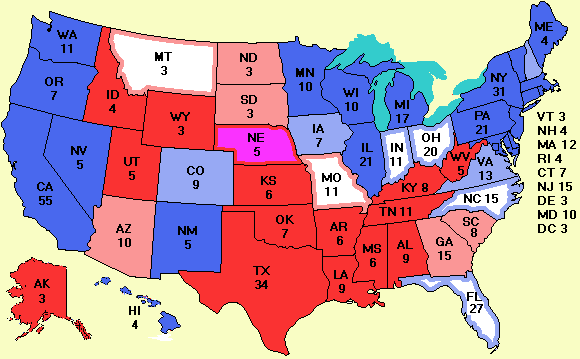
Obama beats McCain 365-173, with McCain taking the toss-up State and the Democrats winning Indiana and the single EV from Omaha's Congressional District on a takeaway.
More interestingly, the Senate was projected to break 58-42 for the Democrats (again including Sanders among their ranks); the final result, after the Franken-Coleman recount, was actually 59-41.
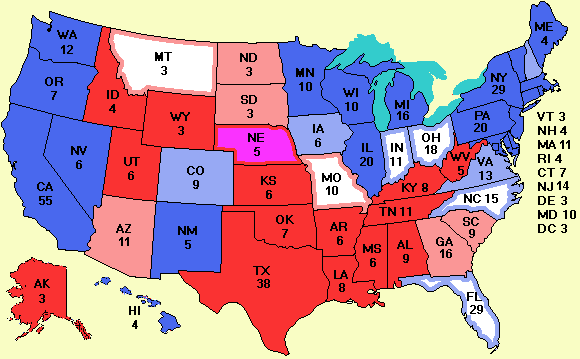
Now, what do these maps tell us? For one thing, prognostication is only as good as the polling done in advance of it. Final results in any State can swing a couple points either way. A more important lesson, however, can be learned from the early polling. This is what the 2004 map looked like on May 24th, 2004 (the first day the site was up and in operation):
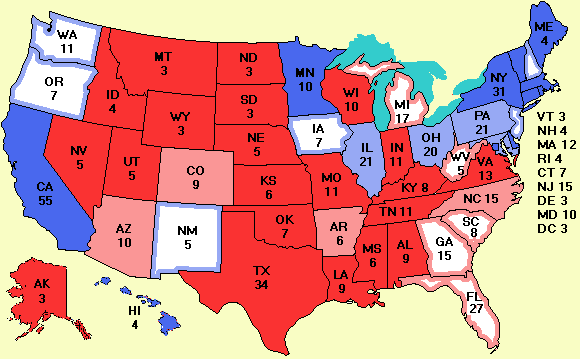
At first blush, this map - which shows Bush beating Kerry by a 281-257 margin, seems pretty accurate; yet several of the States (Michigan, Ohio, Wisconsin, Iowa, and New Mexico) are wrong. Some of this is no doubt simple error; but part of it is also the result of actual changes in the electorate (eg., Michigan drifting Democratic, Ohio drifting Republican).
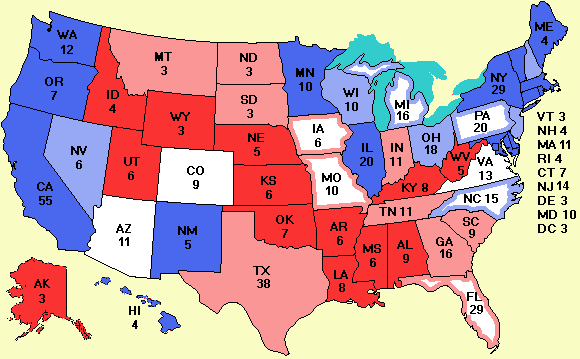
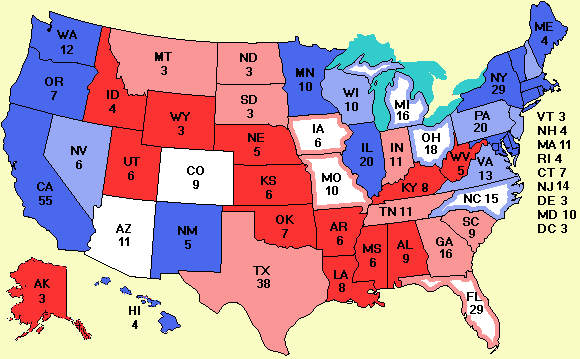
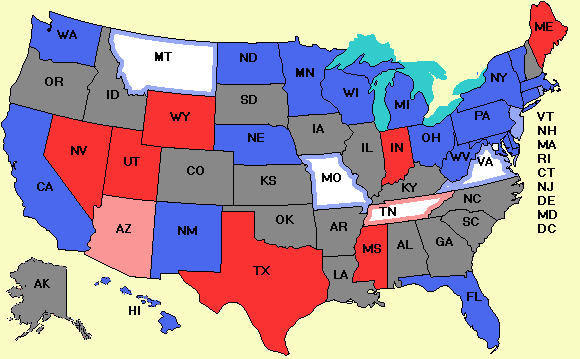
The map from four years ago is even more dramatic:
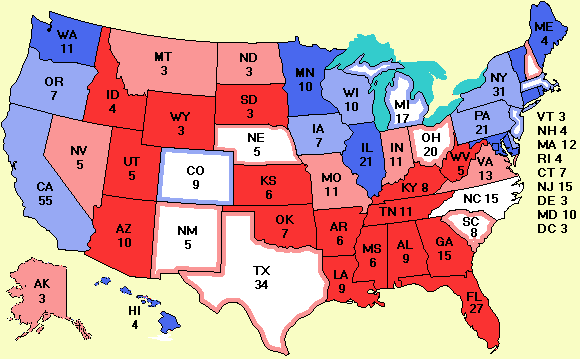
Here we see Obama and McCain running neck and neck (with Obama leading by a 264-259 margin; North Carolina - with 15 EV's is deemed too close to call). Interestingly enough, the Clinton-McCain map from that same date was closer to the mark:
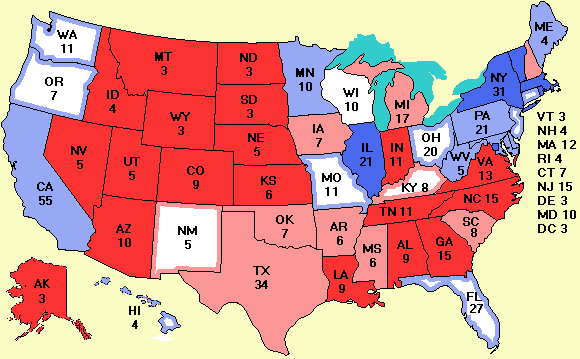
Here we see Hillary beating McCain 284-244, with Wisconsin (10 EV's) too close to call; in some ways Clinton's polling was actually a more accurate reflection of Democratic preferences, showing the effects of Clinton's endorsement of Obama and the intra-party healing that followed that move.
That said, it's interesting to look at where the 2008 race stood on Labor Day - the traditional fall campaign kickoff date:
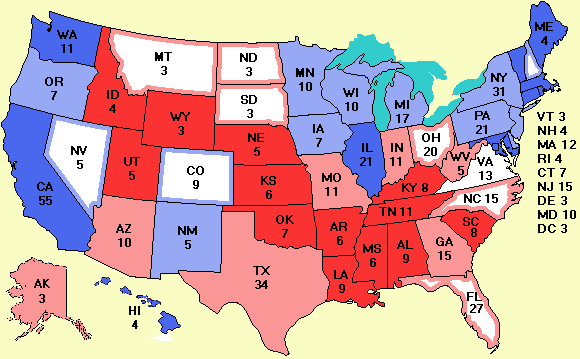
As you can see, the race is still close even as September begins: Obama leads a united Democratic Party over a Republican Party that was disenchanted with John McCain (who conservatives saw as a RINO); due to Hurricane Gustav delaying the arrival of delegates from the South, the Republican Convention (in St. Paul, MN) had not actually been held yet, an unprecedented factor in this election (it marks, in fact, the latest nomination convention in history; it came that late due to the 2008 Summer Olympics). Over the next two weeks, several things happened: McCain chose Sarah Palin as his "game changing" running mate, the GOP enjoyed a short-lived post-nomination bounce, and then the stock market tanked, beginning with the Lehman Brothers' bankrupcty on September 14th.
The public reaction to the market collapse and subsequent Wall Street bailout is a case study in how unexpected events can affect a Presidential campaign. Unemployment was already rising rapidly (along with oil prices, BTW) and market analysts had been calling it a bear market for almost three months. Yet during the last two weeks of September, the wheels fell of the McCain campaign and the public swung sharply to Obama. Here is the map as of Septemebr 15th, at the height of the McCain post-convention surge:
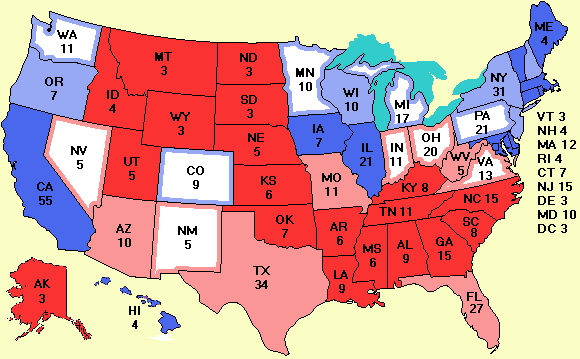
As you can see, it's a dead heat, with McCain leading by a 270-268 margin. Yet by October 1st, this is the situation:
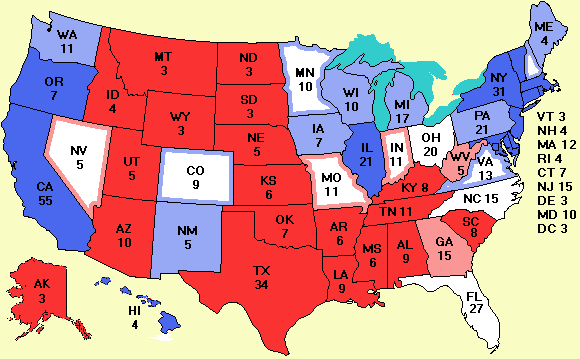
The map shows Obama up 286-190, with three key States - Florida, Ohio, and North Carolina (collectively, 62 EV's) all too close to call, but trending Democratic. The coming landslide is taking shape.
The moral of this story is:
- A site like this is only as good as the polling data; polling data can vary as much as 3-4%. Multiple polls increase reliability, but never to more that 1-2%, and then only if all the polls trend the same way. Following the site's methodology, any State marked as "Barely" Democratic or Republican could flip on election day, depending on the difference between polling data and actual preferences.
- Even good polling data can be bad. Pollsters often skew their data based on the past voting history of demographic groups. This tends to result in polls favoring Republicans for a number of solid historical reasons:
- Older voters tend to be more reliable in their voting habits; pollsters, noting this fact, score older voters' preferences as having more weight. Older voters currently trend Republican.
- Younger voters tend to be less reliable in the voting habits; following the logic above, younger voters - who trend Democratic - tend to be given less weight in determining poll results.
- Hispanic voters - a key constituency in both 2008 and 2012 - behave and are treated in the same way as younger voters.
- Older voters tend to be more reliable in their voting habits; pollsters, noting this fact, score older voters' preferences as having more weight. Older voters currently trend Republican.
- Turnout can overwhelm polling results. Polls may indicate that one candidate is ahead, but aberrant turnout (remarkably strong or remarkably weak) can alter election results by as much as 3-4% either way.
- The advent of early voting has confronted pollsters with new patterns they may not fully understand:
- Early voters tend to favor Democrats (younger and lower income voters tend to avail themselves of early voting more than other voter groups).
- Some States have relaxed absentee voting rules rather than embrace early voting; absentee voting tends to favor Republicans (older and higher income voters, as well as military personnel, tend to vote absentee more often; only disabled voters - generally a Democratic constituency - run the other way).
- Sudden shifts in popularity won't be reflected in early voting; a late breaking gaffe, scandal, or key event can't change the vote of someone who's already cast their ballot. Consequently, some measure of "look-back" logic needs to be applied in considering the effects of early voting (more than usual, since early voting can often occur two weeks or more ahead of an election, depending on the State).
- Early voters tend to favor Democrats (younger and lower income voters tend to avail themselves of early voting more than other voter groups).
- Most importantly of all, public opinion really does change in the course of the typical Presidential campaign. The shifts in polling in 2008 from September 15th- October 1st are a clear example of what happens when the voting public reevaluates its respective impression of the candidates before it.
Tanenbaum's site uses multiple polls to track outcomes. It does not use national polls, but rather State polls, since races are always determined at the State level (save for Congressional races, which operate at the District level). Non-partisan polls are used, although some "left-wing" and "right-wing" pollsters get their results included (including Rasmussen, which tends to favor Republicans). A look-back window is used to reduce "jitter".
Consequently, posting "The latest Rasmussen poll has Romney up by 4 nationwide!!!" isn't going to impress anybody (and certainly not me); what serious people look for in handicapping this sort of thing is sustained performance in multiple polls, not single poll results.